After your company’s website launched, setting up your Google Analytics account was probably one of the next items on your list. Whether you worked with an agency throughout the process or got things up and running on your own, you knew that Analytics was an essential tool to put on your site.
But once the code was installed on each web page, you might have been left scratching your head. “What do I do now?”
Despite how easy it may have been to create your account and install the code, this isn’t one of those “set it and forget it” kind of tools. Sure, Analytics automatically collects a wide variety of data to put together a detailed audience analysis, rank pages by traffic, and show you how people arrived at your site in the first place. However, there are several things you have to do in order to collect this data in a way that you’ll actually be able to work with it.
Google Analytics might seem a bit daunting at first, and that’s ok. There are dozens of features and reports available, so it’s practically impossible to tackle them all. The good thing is you don’t have to do it all to be successful. But before you dive in to which reports are most valuable to your business, here are some basic items to take care of first.
Configure Your Account
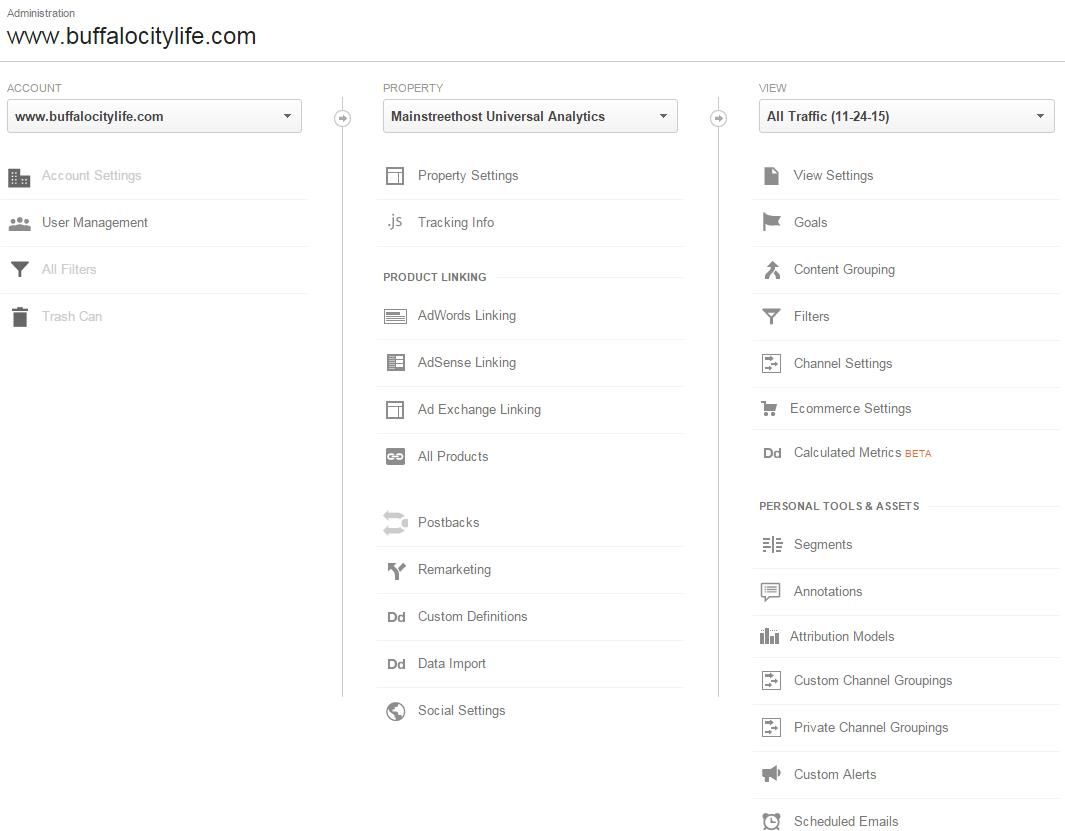
At the administrative level, there are three tiers within your Google Analytics profile. Click “Admin” at the top of any page and you’ll see the hierarchy within your login. Account is the highest level of organization in Analytics, and you can have more than one within the same login information. Under most circumstances, you’ll only need one Account – unless you’re a business that oversees Analytics accounts for clients.
Within each Account, you can create one or more Properties to represent each website or app under your company name. So if you have a corporate website and a separate ecommerce site or a website and a mobile app, you can track this data separately while still keeping it all under the same Account. At the View level, you can set more specific goals, adjust settings, and segment your website’s audience. For example, in Mainstreethost’s Google Analytics account, we have created Views for all traffic, blog-only traffic, and website-only traffic. This allows us to look more closely at audience demographics and behavior across different types of content.
Filter Out Internal Traffic
Once you have the structure of your profile organized, one of the most important things to do next is to filter out your IP address. This will prevent the data from being skewed due to traffic from your own employees. After all, it doesn’t really matter what your team is doing on your website; you want to know what potential customers are doing! The sooner you can set this up, the better, to ensure the most accurate data collection by Google Analytics. Luckily, it only takes about a minute to do so.
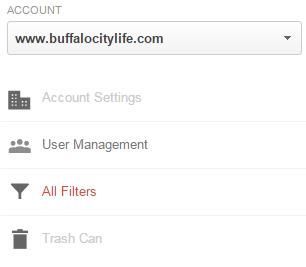
At the Account level, click the “All Filters” link, followed by “+ New Filter” and “Create New Filter.”
From there, you can select the IP blocker from the Predefined Filters list and enter in your company computer’s IP address. You can find your public IP address by asking your network administrator or searching “What is my IP address” on Google. Simple as that!
Create Views
Now that you’re familiar with where to find the View section of your Analytics account, it’s time to start setting some up. Views allow you to segment data so you can focus on specific traffic or goals, and compare and contrast to other groups. In the past, our blog was on a subdomain (blog.mainstreethost.com) of our main website’s domain (mainstreethost.com). So, we created a View that combined the two together as well as separate Views for each. This allowed us to look at both our web traffic as a whole and laser in on a specific behavior of one of these audiences.
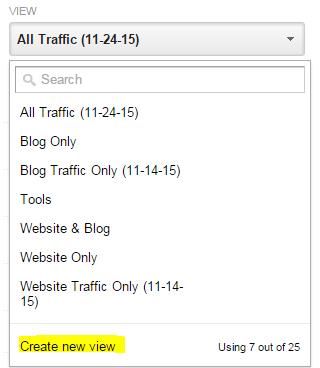
In the View dropdown, select “Create new view” at the bottom. Each Property can have up to 25 Views, which is probably more than you could ever need.
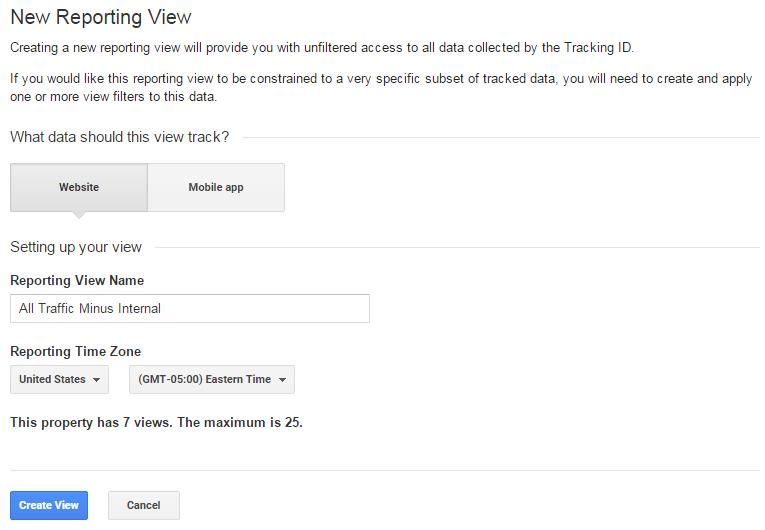
Next you’ll choose which data to track (website or app), name your View, and select a country and time zone. Once it’s created, you can go back to the Admin page and edit specific settings (like the URL associated with the View) and link up your Google AdWords account.
Link to your AdWords Account
Even if you haven’t started a pay-per-click (PPC) advertising campaign through Google AdWords yet, it’s important to create an account and link it up to Analytics. That way when you do start running campaigns, you can see the impact of your investment right alongside your Analytics data. You’ll be able to see the percentage of traffic that arrives at your site through PPC compared to direct and organic search traffic, as well as how a user’s time on site varies based on traffic source.
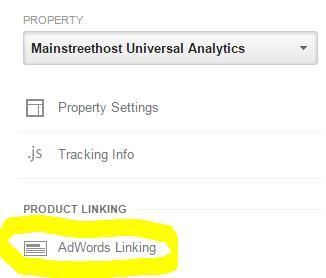
To link up your account, go to the Property column and click on “AdWords Linking.”
Next, click on “+ New Link Group” and you can enter in your AdWords account information. Unless you have multiple accounts, you will only need one Link Group.
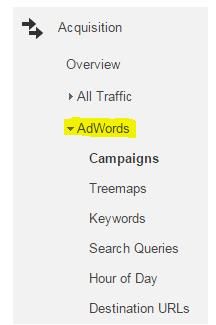
Once you start an AdWords campaign, the data will pull over to Analytics and you’ll be able to access it in the Reporting section under the Acquisition heading.
Here you can look at the specific search queries that led to a user clicking on your ad and arriving at your website. You can also see which landing pages (destination URLs) and times of day led to the most clickthroughs to help you adjust your strategy as needed. It’s a great way to uncover unexpected successes and make the most of your PPC investment.
Getting Familiar with Analytics
Once you have some of the basics under your belt, you need to get yourself more familiar with the Analytics platform itself. You certainly don’t need to know where every report and data type is located, but having a general understanding of where things are will help make it a bit less intimidating.
Navigation
First is the main navigation at the top of every page in Analytics, which you already have some familiarity with from setting up some of the previously mentioned features. There are four links that will direct you to the main sections in Google Analytics: Home, Reporting, Customization, and Admin. The Home link takes you to the list of Views that you’ve set up so you can see a very high-level overview of how each is performing.
The Reporting tab takes you to all of the Analytics reports and dashboards available for viewing and analyzing data. Here you can look at audience behavior, page performance, and conversion data to determine the strengths and opportunities of your website. You can narrow down your audience by metrics as specific as location, demographics, traffic source, and technology used to view your website.
Google Analytics also lets you dig deeper into specific behaviors such as conversion rates, landing pages, bounce rates, and much more. These are key pieces of information to help determine if your website is laid out in a logical manner, is easy to navigate, and provides enough engaging content to keep visitors around.
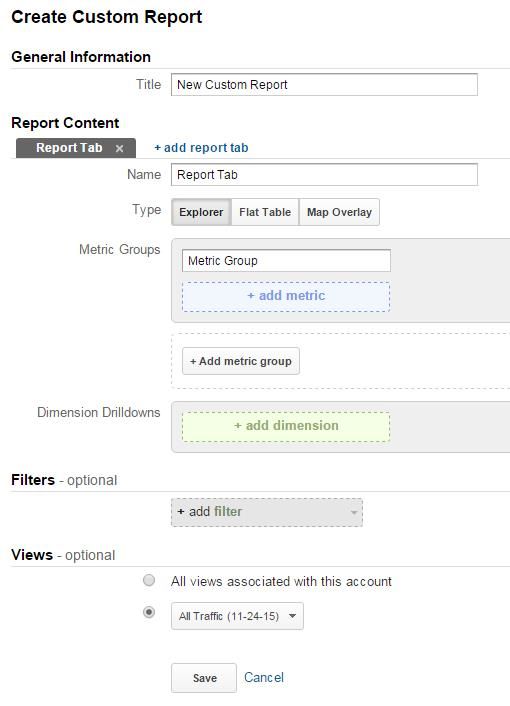
Next is the Customization tab, which you probably won’t use until you’re more familiar with the reports already provided by Analytics. However, this is an area with significant opportunities to expand your research and data collection, so it’s worth checking out when you’re comfortable with the tool. Here you can create custom reports, allowing you to choose how data is displayed as well as which elements of user behavior you want to focus on. This is a way to collect the same types of data as the Reporting section, but this time it will be catered to how you want it organized and filtered.
We already covered the Admin section a little bit, but this is where you can view the hierarchy of your Account, add or edit Properties and Views, edit user permissions, and much more. This is the powerhouse of your Analytics account and is where all of the high-level changes can be made.
Settings & Notifications
In the top right corner of every page, you’ll notice gear and bell symbols located next to the email address associated with your Google account.
The gear allows you to edit user settings, send feedback, and get answers to your questions directly from Google. The bell indicates notifications of any Google-generated messages with maintenance requests or errors within your account. Make sure you pay attention to these notifications, as they could have a significant impact on your account in terms of Google rankings, penalties, AdWords campaigns, etc.
Reports
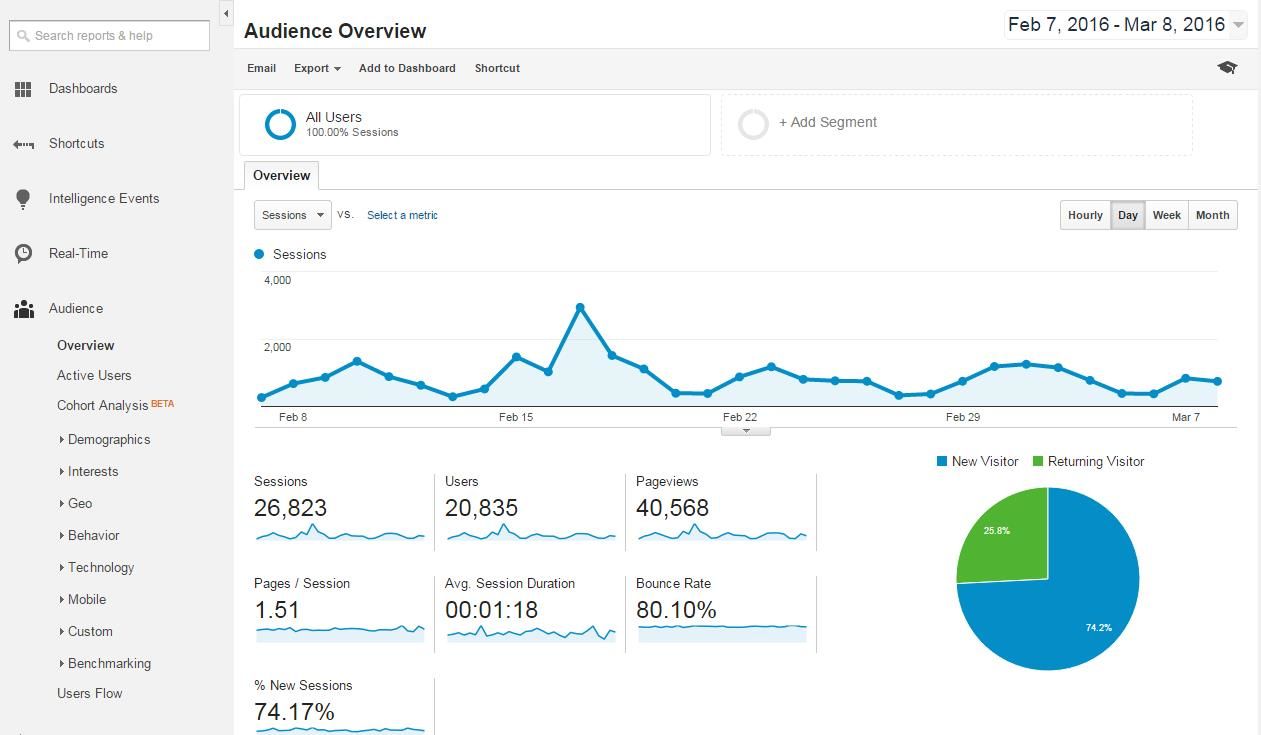
Within the Reporting tab, all of the various Analytics reports are located on the left-hand side of the page. You can either click on each section to view the dropdowns of more specific reports or use the search bar if you already know what you’re looking for.
Once you’ve selected which report you want to look at, you can add segments to filter the data more narrowly. For example, if you want to look only at the traffic that resulted in a purchase from your site, you can go to a report and add a segment for those that made a purchase.
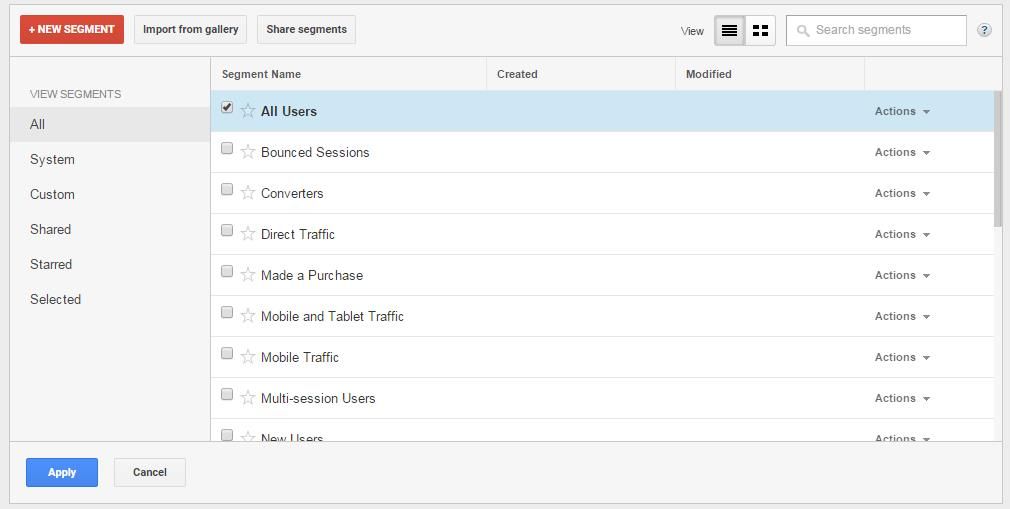
To do this, simply select any report from the column. For this example, I clicked on “Mobile” within the “Audience” section, then on “Overview.” Right above the data you’ll see a link to add a segment. If you click on that, you’ll see the screen below.
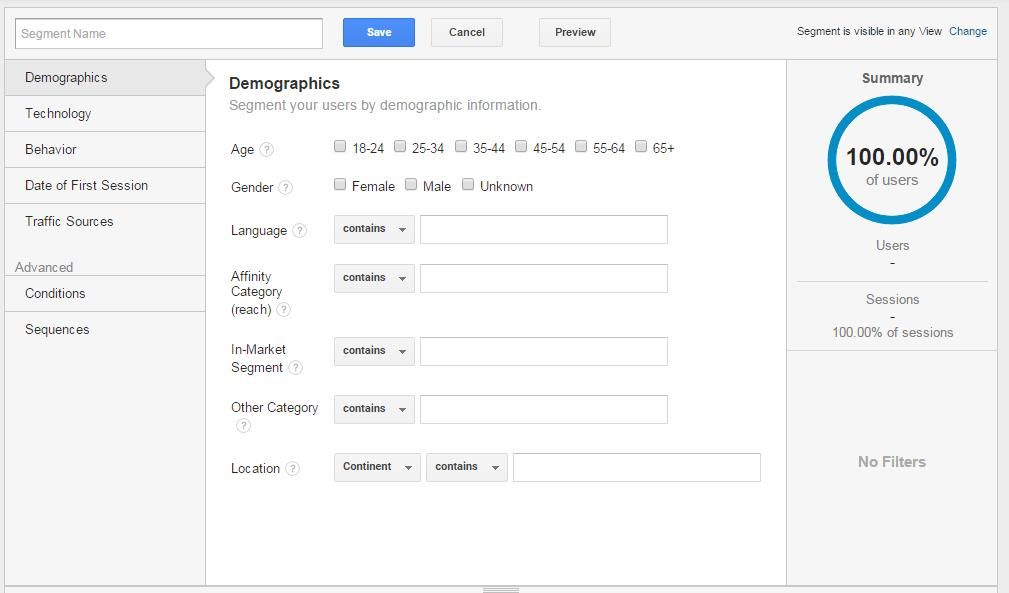
You can either choose from Google-provided segments or create your own (by clicking “+ NEW SEGMENT”) based on a specific goal or target audience you want to analyze. Then after setting up one or more segments, you can look at that report’s data with all of the traffic combined or by one segment at a time. It all depends on what you’re trying to uncover with this data. If you’re just getting started with Google Analytics, it’s best to stick with the preset segments. Once you’ve more specifically defined goals for your website or made some changes, you can dig a bit deeper into your audience’s behavior.
Analyzing the Data
After your Google Analytics account has been up and running for some time and you’ve been able to familiarize yourself with the plethora of options and data it provides, it’s time to analyze this data. There are so many different reports available, how do you know where to begin? This is certainly not a comprehensive list, but these four reports can provide value to any organization using Analytics.
All Traffic – Source/Medium
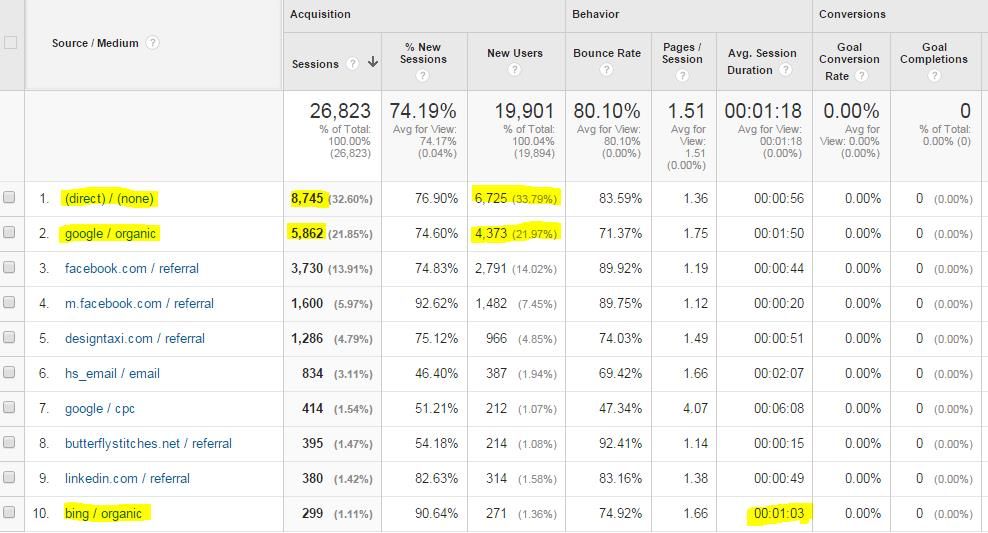
This report shows you the breakdown of where your web traffic is coming from (organic search, direct, social media, etc.), which can help identify opportunities for improvement and potentially uncover an audience you didn’t realize was there. To access this report, go to the Acquisition section, click on “All Traffic,” and then on “Source/Medium.”
In the example below, you can see that direct traffic outperforms Google in terms of total sessions, but a larger percentage of this traffic was new users. You’ll also notice that even though Bing doesn’t drive as much traffic as the other sources, the average time on site is a bit higher compared to social networks like Facebook and LinkedIn.
These insights are incredibly valuable to guiding your future marketing strategy because they show you where your time may be best spent. For us, we may want to focus on our organic search traffic since these individuals are spending significantly more time on our site than other visitors. These users are a large percentage of our total traffic and represent some potentially very qualified leads. We would want to look into ways to increase traffic from organic search, such as paid advertising, to see how this impacts both traffic and conversions.
Site Content – All Pages
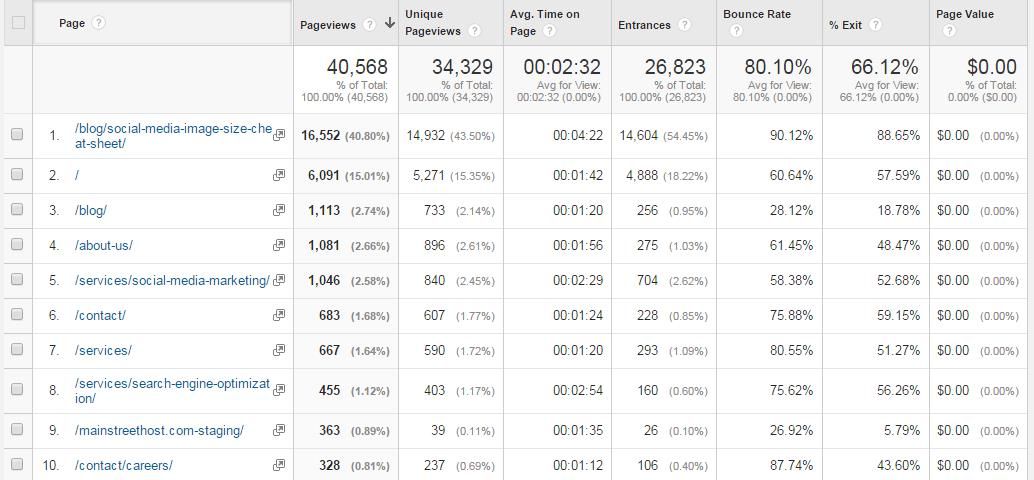
The All Pages report can sort your web pages based on traffic volume, time on page, bounce rate, and entrance and exit percentage. To access this data, go to to the Behavior section, click on “Site Content,” and then on “All Pages.” For websites that have a blog, this feature is essential. You can see which content performs the best to help generate ideas for future posts. For example, our “Social Media Image Cheat Sheet” is by far our most-visited piece of content, so we can infer that our readers are very interested in social media marketing and/or graphics, and cater our content accordingly.
This is also a great place to look at which pages are underperforming. Maybe you thought a blog post would speak to your target audience or that a particular page layout would be effective. This is where you can see the traffic that page received or if a previously top performing page took a dip after a redesign. With the data that this report pulls you can not only see what information was a hit with visitors, but where you may have missed the mark and could improve.
Site Content – Exit Pages
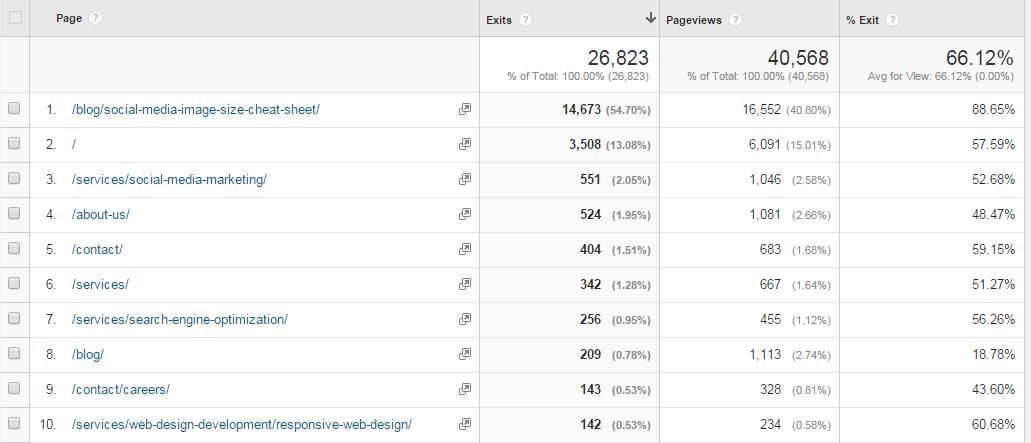
Aside from which pages or pieces of content are successful on your site, it’s equally important to understand where people are leaving your site (and try to figure out why that is). Like the previous report, you’ll go to the Site Content section, but instead click on “Exit Pages.” This will show you where to investigate your content further to determine if visitors are finding what they need or if the content isn’t as high-quality as other pages.
In this screenshot, we can see that our social media, SEO, and web design services are the services with the highest number of exits, and visitors also leave from our About Us and Contact pages quite a bit. Knowing this information, we would want to look at the number of contact form completions we received on these pages to see how it compares to the amount of traffic. If users are getting to these informational pages and not reaching out to us, then we know that we need to reassess our calls-to-action to increase those conversions. It is also an indication that we should look at our services pages to make sure that users know what the next step is and hopefully stick around a while longer.
New vs. Returning Visitors
We briefly touched on this before, but when looking at our website’s traffic sources, we noticed that direct traffic was the most popular source. Digging into this a bit further is the New vs. Returning Visitors report, which you can find within the Behavior dropdown of the Audience section (don’t confuse the Behavior dropdown with the Behavior section).
This report compares how these groups spend their time on your site and how many pages they view. For us, we can see that a returning visitor is not only a more qualified lead because they came back, but they view more pages and spend a lot more time on our site than a new visitor.
This doesn’t mean that new visitors are completely worthless, of course. After all, you have to get your return visitors from somewhere! Fresh eyes on your company’s website mean viable opportunities to educate and hopefully convert them into satisfied customers. It’s important to approach your website from both of these perspectives. If you had never heard of your company before, what are some of the first things you would want to know? Make those pieces of information eye-catching and easy to find.
If you were returning to your website, what would you be looking for? Items like pricing, your blog, and customer reviews would likely be top-of-mind, so it’s important that those things are easy to locate as well. It can be hard to cater to such a wide audience with varying needs, but the key is making the path to conversion as simple as possible and all of your content easily accessible. This is where using this report in conjunction with the others can come in handy. Getting a better sense of who your audience is and how they’re currently behaving will help you immensely when it comes to better tailoring your marketing strategy.
Time to Get Started
Mastering Google Analytics takes time, so it’s important to prioritize the features and reports that are most important to what you’re trying to accomplish at the present time. If your website is relatively new, you might be focusing on traffic sources to see how you’re ranking in search engines and how your social presence contributes to visits. A more established site might prompt you to pay more attention to specific user behavior and conversion rates so you can fine-tune your website and marketing strategy.
Wherever you are in the process, there’s no question that Google Analytics is absolutely critical to a successful online presence. You’re hard-pressed to find a tool that’s as comprehensive and easy to use (and you certainly can’t beat the price), so taking the time to learn all that it has to offer is well worth it.


